Planning and review
Reports and activity history
Trace stock changes and understand what stock value, sales, and margin reports include.
On this page
Follow the activity trail
Open History to review movements and other saved changes. Filter by product, activity type, and date, or open a product page for its recent entries. Export history as CSV when you need to examine it outside the app.
Older activity rolls into monthly archives. A full backup loads those archives too; wait for a successful download rather than assuming a product export includes them.
Read stock and movement reports
Reports includes stock value over time, top movers, dead stock, value by category and location, margins, and saved count differences. Stock value is based on purchase cost. The value-over-time chart uses saved snapshots, so it does not recreate days from before snapshots were collected.
A quiet product may need review, but the report can only describe the activity that has been recorded. Check the date range and whether the stock was actively sold or used during that period.
Separate sales from other removals
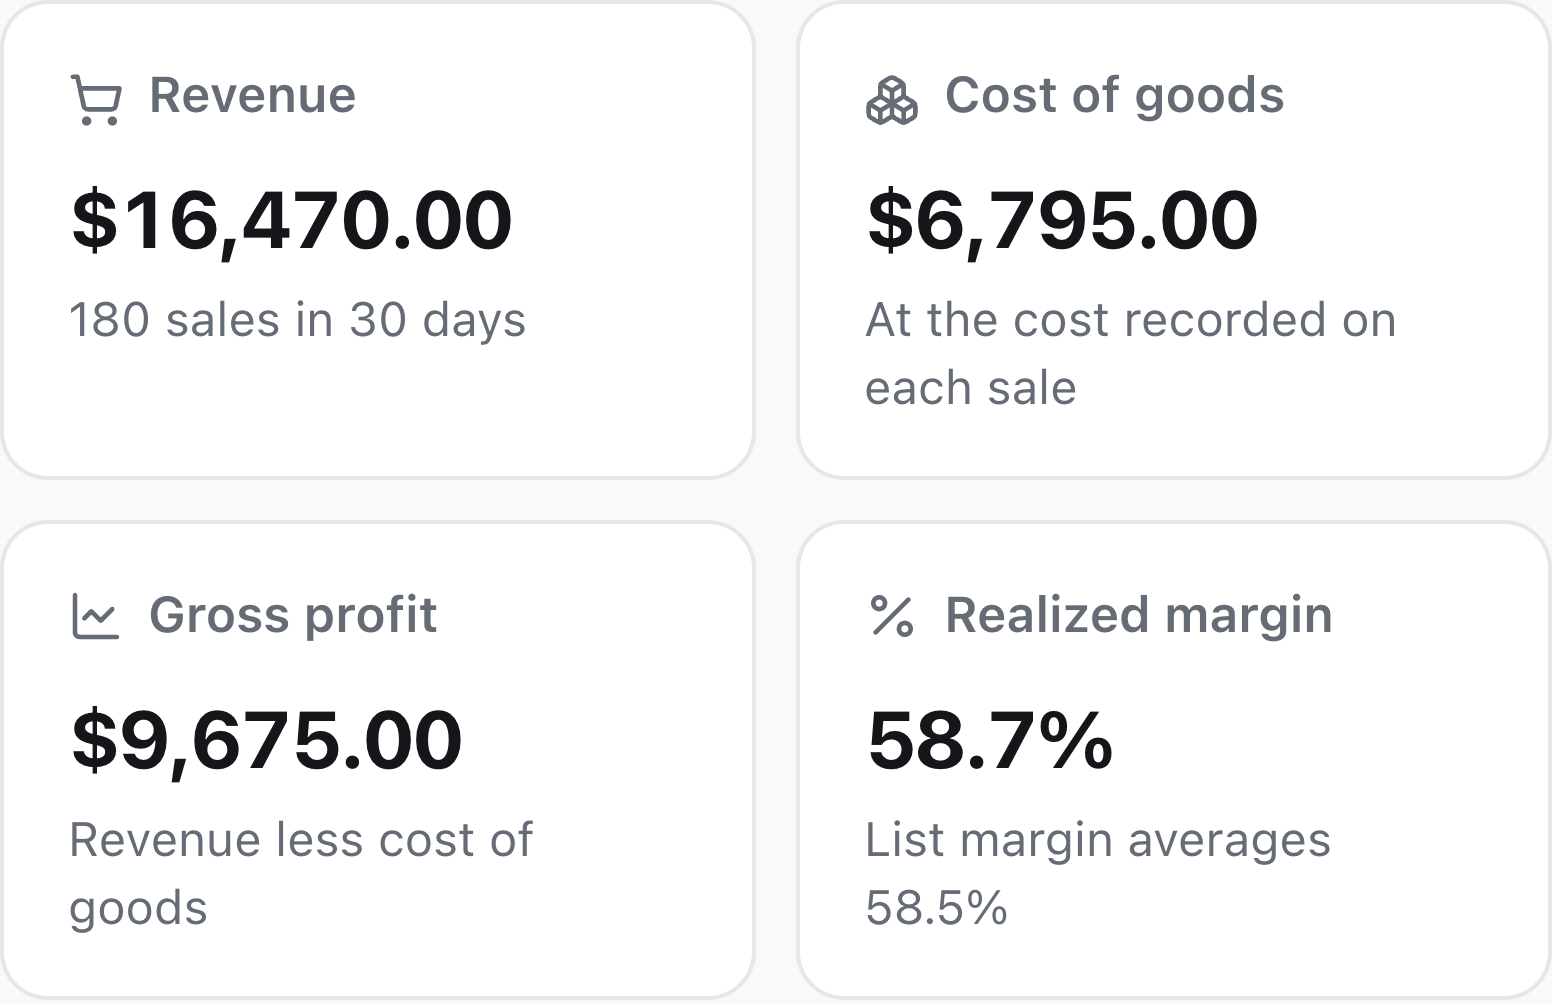
The sales report uses recorded sales, including their recorded revenue and cost of goods. Gross profit is revenue less that cost; realized margin is gross profit divided by revenue.
A product’s current list price and cost describe a different comparison from past sales at their actual recorded values. Incomplete sale entries make an incomplete sales report.